- Client
- Trusted Media Brands
- Year
- 2026
- Status
- Live
Analytics Dashboard
The reporting stack that retired an enterprise subscription. Now the team owns its own numbers.
- Cloud Run
- BigQuery
- dbt
01 — The problem
The black box
Marketing and content data reached reporting through a third-party connector. It worked. It was also a black box the team did not own and could not change.
Nothing about that is specific to a media company. The tool works, the invoice recurs, and the one thing nobody can do is change it.
What changed hands
- Ran on
- RentedA paid subscription
- OwnedCloud Run, BigQuery, dbt
- The reports
- RentedWorked
- OwnedThe same reports
- Owned by
- RentedNot the team
- OwnedTMB
- Could it be changed
- RentedNo
- OwnedYes
Two Sources, Three Services
Cloud Run pulls the data in. BigQuery stores it. dbt shapes it into the models. The reporting layer on top is custom, and the team builds its own reports against it.
01 Sources
- Marketing data(Source)
- Content data(Source)
02 Ingestion
- Cloud RunPulls the data in(Process)
03 Warehouse
- BigQueryStores it(Store)
04 Transforms
- dbtShapes it into models(Process)
05 Reporting
- Reporting dashboardUnchanged for the reader(Output)
Feedback loop: Reporting back to Transforms (Edit the model, edit the report).
Two sources in, five stages, one loop back into the models.
Inside The Stack
Layer by layer, in the order the data moves. TMB's systems are internal, so every frame below is a concept render, not a screenshot. The ones you can go and use — Éclat, Starrd, OneLapse — are on the work index.
L1
Ingestion
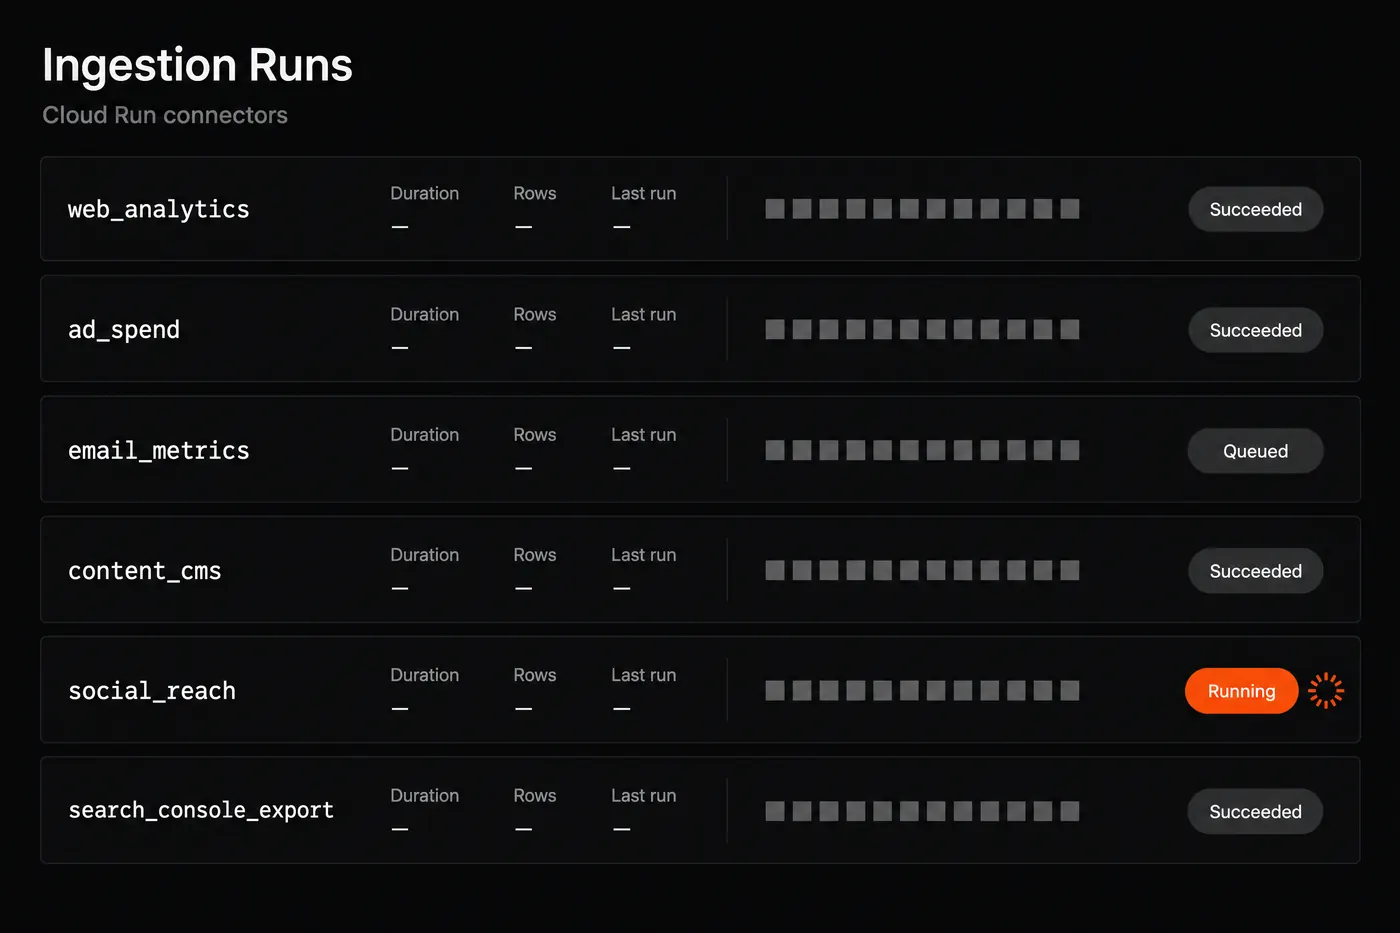
The layer TMB was renting. It runs on Cloud Run now.
Cloud Run
L2
Warehouse & transforms
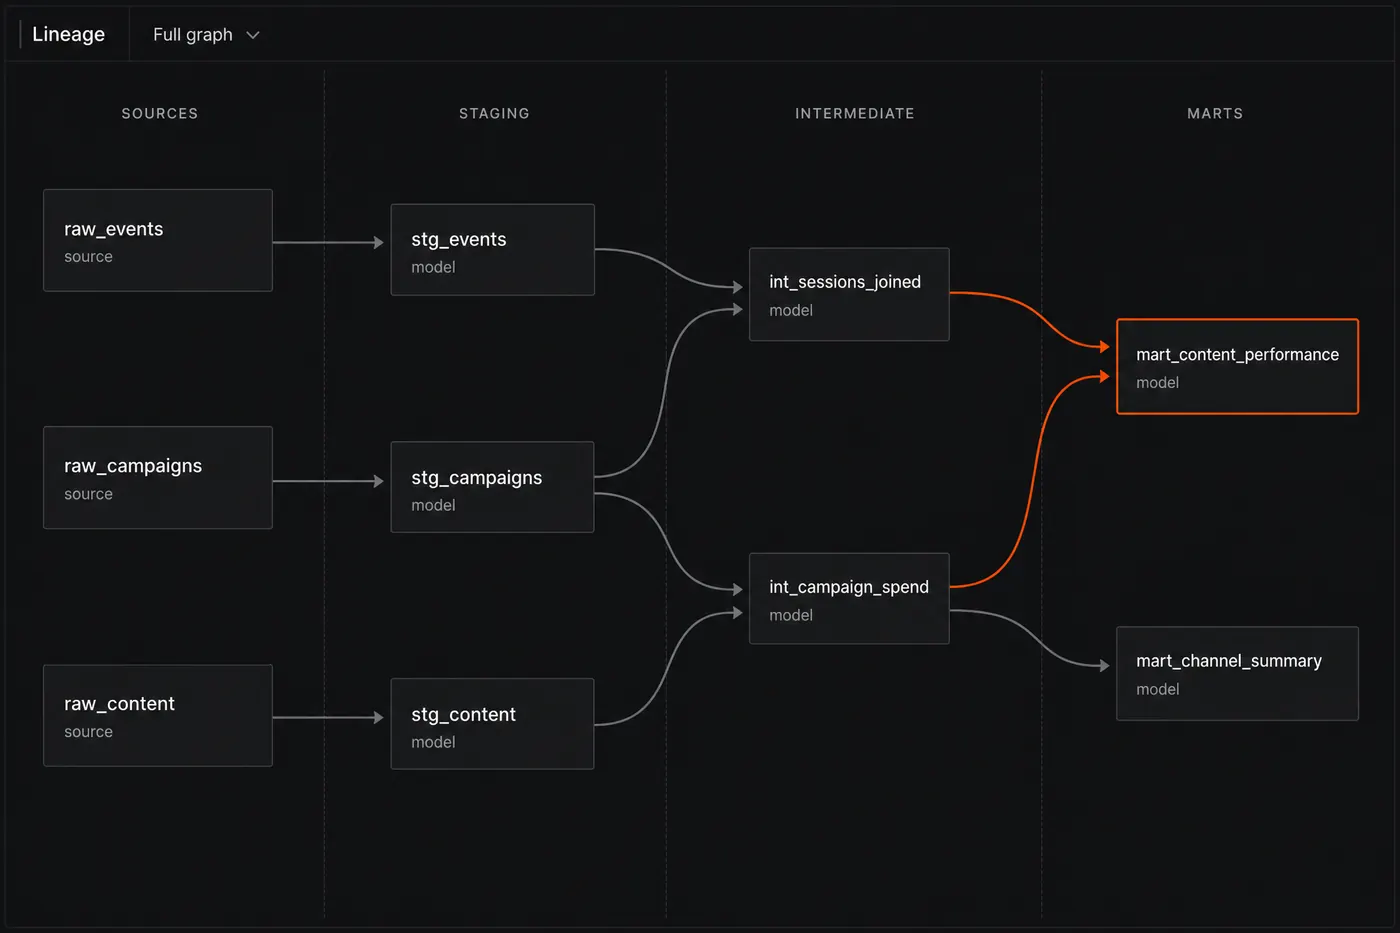
Where the shape of a report gets decided. dbt builds this graph from the models, so nobody maintains it by hand.
BigQuery · dbt
L3
Reporting
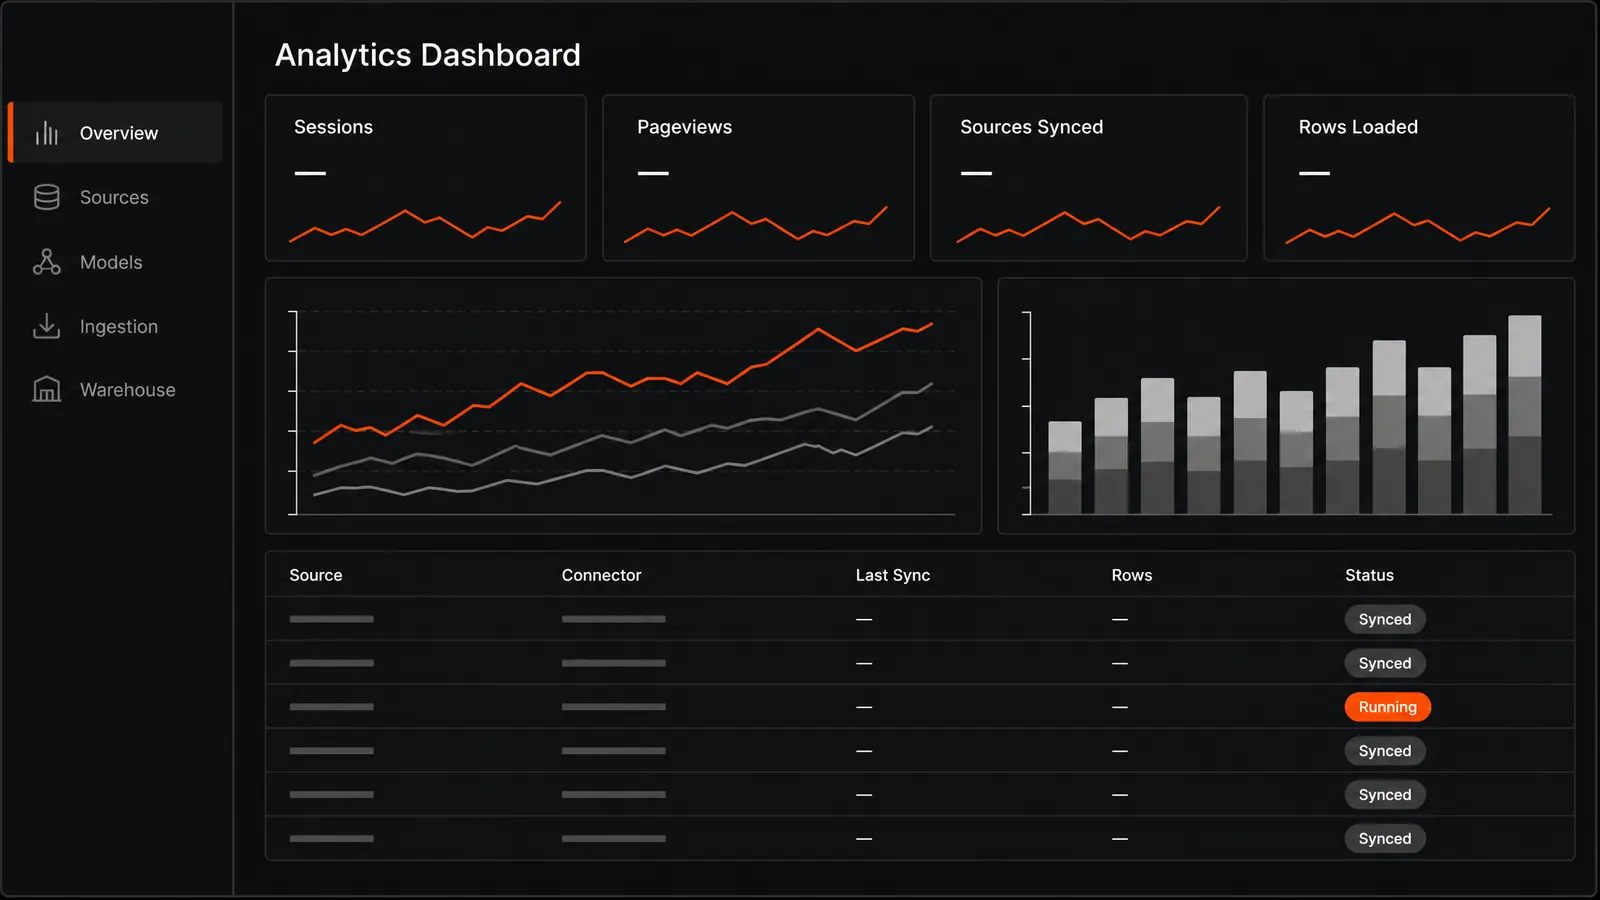
The screen the whole stack exists to fill.
The team answers its own questions.
Anyone who needs a number builds the report themselves, straight against BigQuery, and has it the same day — where the old way was to file a request with a vendor and wait days for the answer to come back. The enterprise subscription that used to sit between the team and its own data is retired.
- Turnaround for a new report
- Same dayTurnaround for a new report
Colophon
- Role
- Sole engineer: the ingestion jobs, the warehouse, the dbt models, and the reporting layer. Creative Technologist at Trusted Media Brands.
- Stack
- Google Cloud Platform · Cloud Run · BigQuery · dbt